Category Blog

The state of Berlin must also make its contribution to the Paris Climate Agreement goal of limiting global warming to 1.5°C compared to pre-industrial times. Under the premise of climate neutrality by 2045, the Berlin Energy Transition Act defines, among other things, the reductions that would be necessary for the transport sector[1]It is important to note that current studies point out that the stated target year 2045, and thus also the measures formulated in the Energy Transition Act, are not sufficient to stay below the 1.5°C limit ... Continue reading. Given the current trend, the transport sector in Berlin is projected to emit 8 Mt CO2 e[2]CO2e (or carbon dioxide equivalents) indicates how much a greenhouse gas contributes to global warming in a given period of time compared to the same amount of CO2. ] in 2050. With the goal of climate neutrality, however, this figure should only be 0.2 Mt.[3]The current figure is 5.2 Mt CO2e. Accordingly, the absolute reduction, measured against today's 5 Mt, would even be 7.8 Mt CO2e, taking into account the current trend. At: ... Continue reading

The reduction in emissions needed in the transport sector to achieve Berlin's climate neutrality will inevitably be reflected in the distribution of transport volumes among the modes of transport, or modal split. The developments for the modal split calculated in the feasibility study "Making Berlin Paris-compliant" by the Institute for Ecological Economy Research on behalf of the Berlin Senate are shown in Table 1.


Share
of all routes
2018
Share
of all routes
2050
Relative
change
2020-2050
Motorised private transport 25,9 % 10 % - 61,4 %
public transport 26,9 % 33 % + 22,7 %
On foot 29,6 % 32 % + 8,1 %
Bicycle 17,6 % 25 % + 42,0 %
Table 1: Development of the modal split in the long-term scenario[4]Hirschl, B. et al. (2021): Berlin Paris-konform machen. Eine Aktualisierung der Machbarkeitsstudie „Klimaneutrales Berlin 2050“ mit Blick auf die Anforderungen aus dem UN-Abkommen von Paris. p. 184. At: ... Continue reading

The share of 10% motorised private transport calculated in the 2050 scenario (incl. car sharing) must have 100% alternative drive systems[5]Ibid. S.13 and 174. ]. This vision is supported at the municipal level in particular with subsidies for charging infrastructure for electric automobility. This long-term scenario illustrates that electric mobility, alongside other alternative propulsion technologies, is seen as a key to achieving a decarbonised and sustainable transport system. This article looks at the current spatial distribution of the efforts to attain a 10% rate of motorised private transport in Berlin.


Spatial trends in charging infrastructure

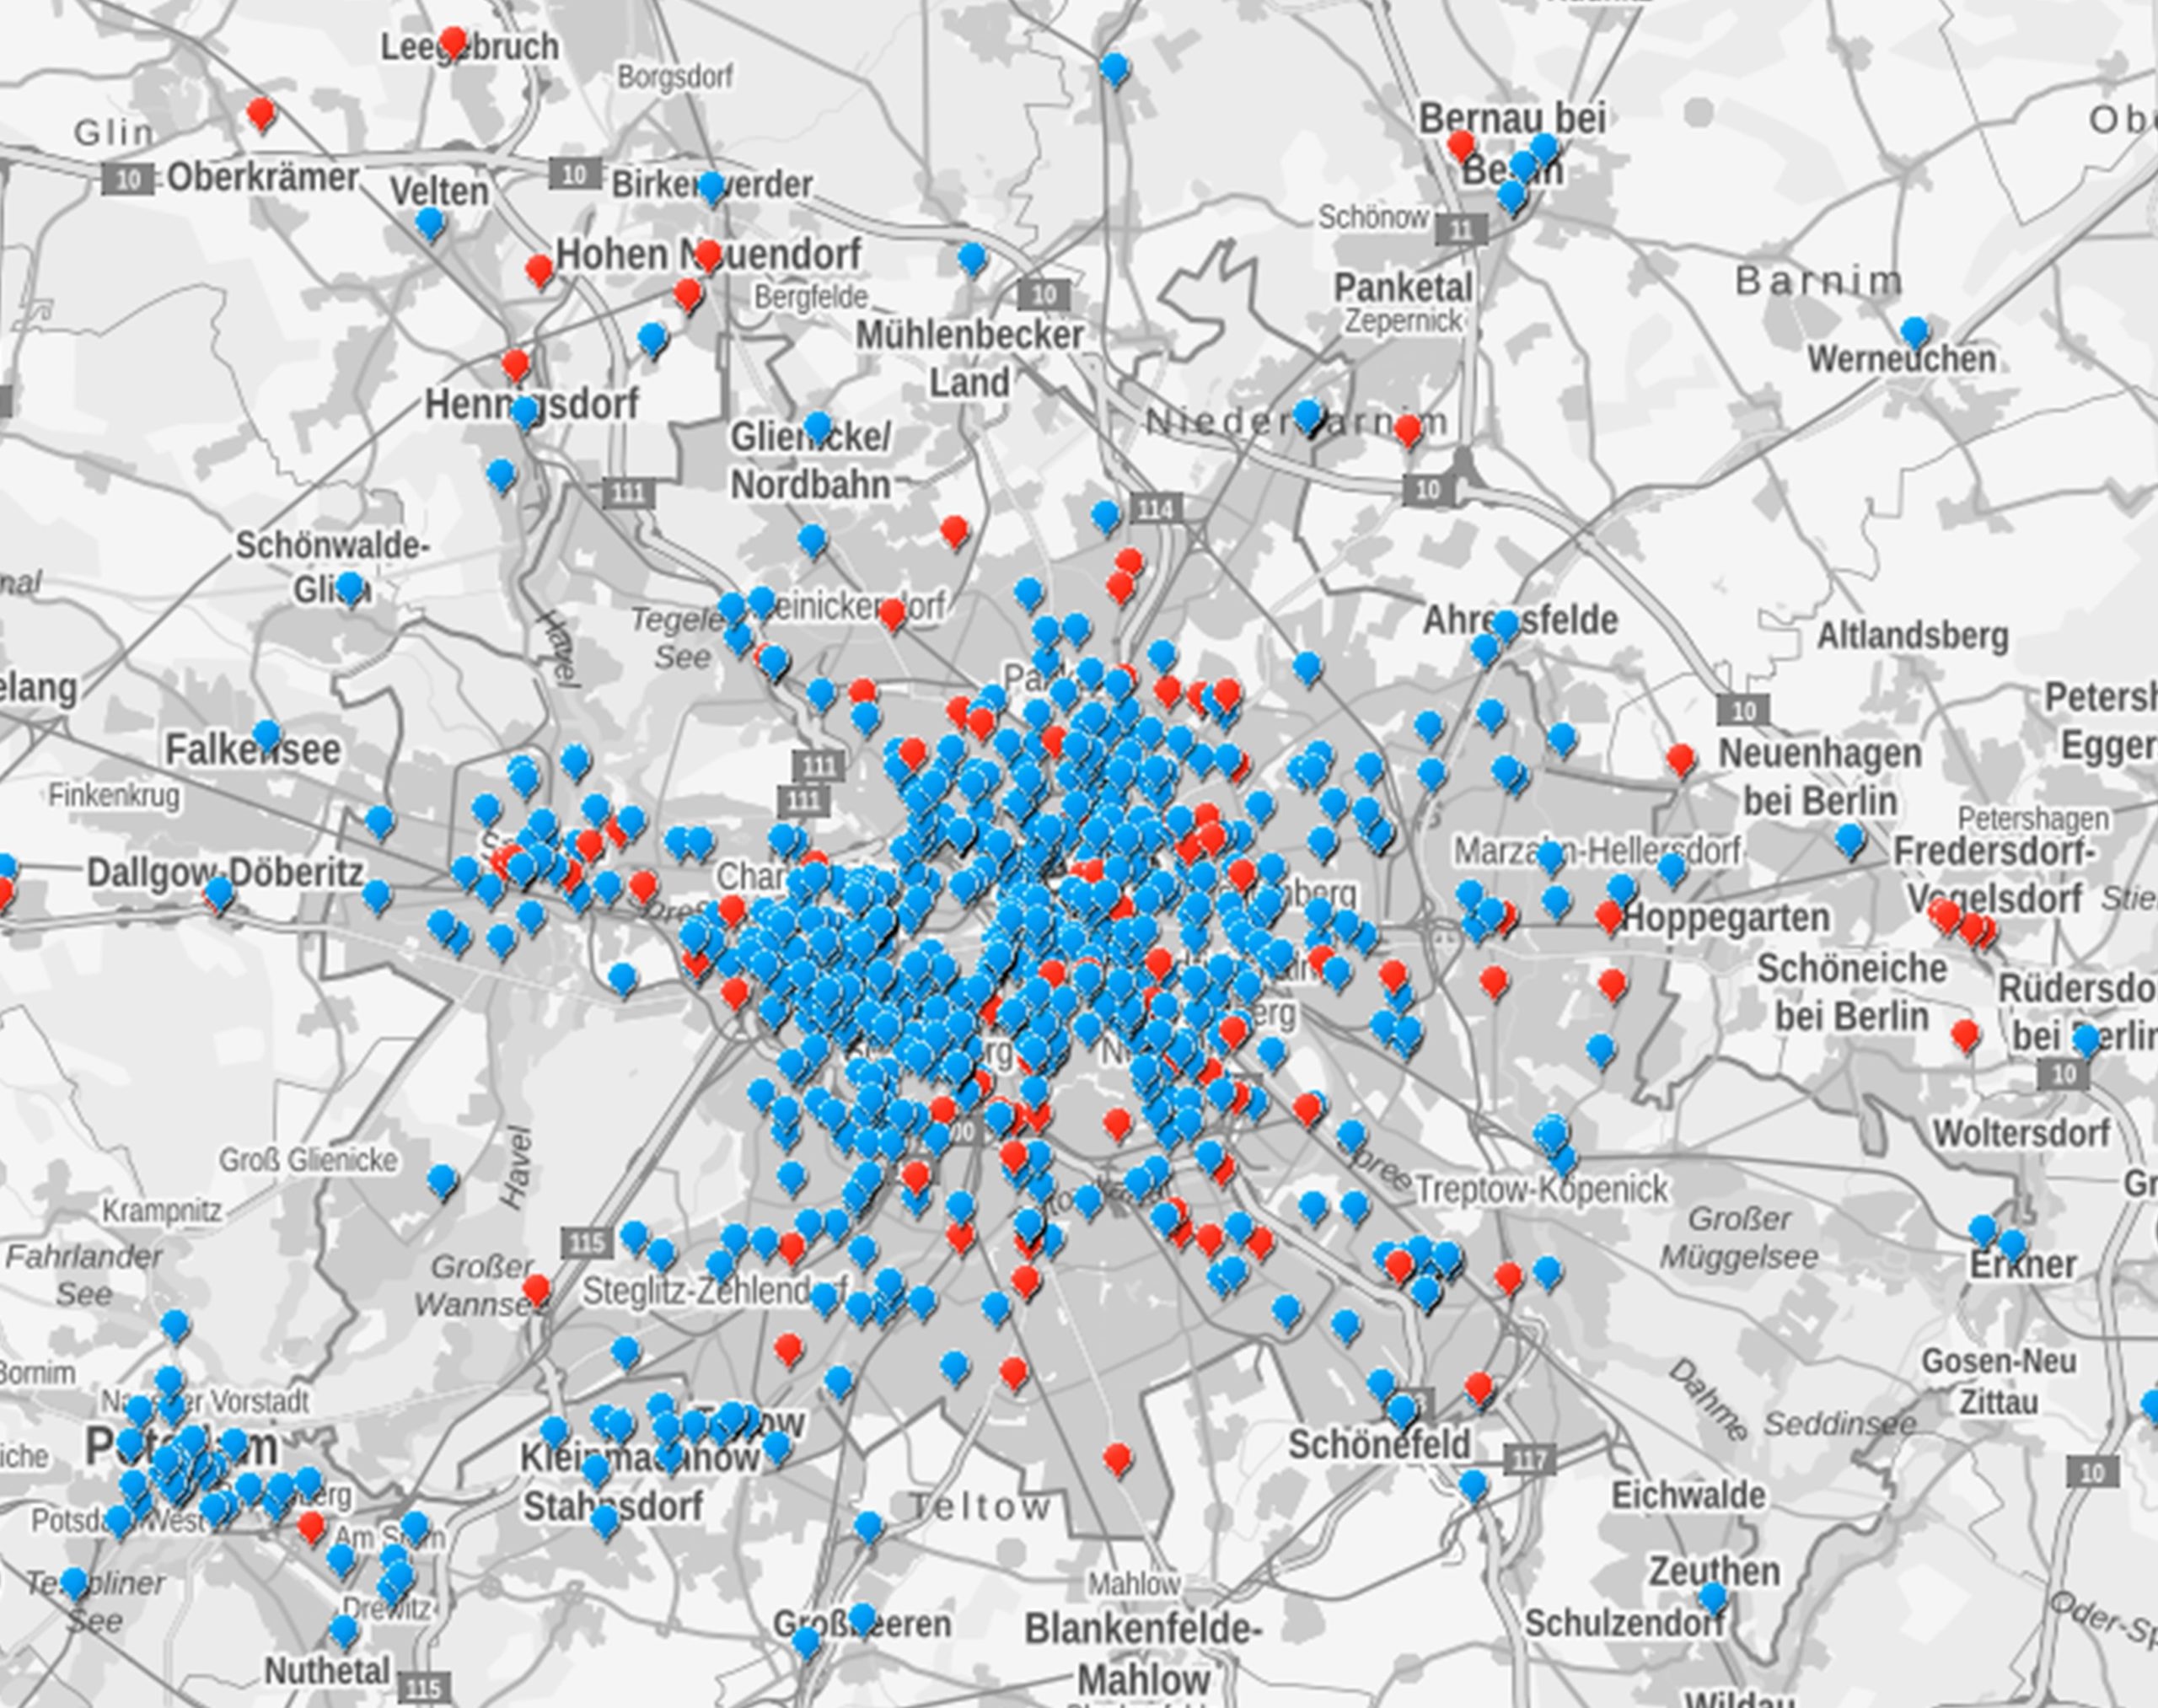
In Berlin's city centre, as in other conurbations[6]Sikder, S.K. et al. (2018): Halten Sie die Augen nach einer Ladestation offen! – Die E-Ladestations-Infrastruktur in Deutschland: eine räumliche Analyse. At: ... Continue reading, there is now a number of charging points. This can be seen in an image from the charging station register (Figure 1).

Ladeinfrastruktur
Figure 1: Berlin charging station register[7]https://www.vda.de/vda/de/themen/elektromobilitaet/ladenetz-ranking/ladesaeulenregister [26.10.2021]

From the spatial perspective adopted in this article, the question arises as to what consequences this concentration of charging points in the city centre entails.


Problems that arise from the concentration of charging points in the city centre

The concentration of charging points in the city centre of Berlin brings with it a number of problems and fundamental questions with regard to the promotion and expansion of electric mobility and its infrastructure.

Berlin has high land use pressure, which has been intensified, among other things, by a population growth of 13% in the last decade and a 9% increase in the number of registered passenger cars. The hitherto one-sided distribution of public road space in favour of the car[8]Mobilitätsatlas. Daten und Fakten für die Verkehrswende. (2019). Heinrich Böll Stiftung und VCD. At: ... Continue reading also contributes to land use pressure.[9]It should be noted that a high population density per m2 is not necessarily harmful to the climate. One consequence: (public) space is highly contested. The expansion of charging infrastructure, especially in the city centre, further increases this pressure, because each charging point is typically accompanied by two parking spaces for electric cars to charge in. In addition, the charging infrastructure has so far often been built on pavements. This gives even more space to the car, which is currently overrepresented in terms of the distribution of space among the various modes of transport[10]Strößenreuther, H. (2014): Wem gehört die Stadt? Der Flächen-Gerechtigkeits-Report. Mobilität und Flächengerechtigkeit. Eine Vermessung Berliner Straßen. At: ... Continue reading. This seems questionable, especially in light of the larger group of pedestrians (30%) than car drivers (26%) in the modal split of Berlin's residential population.[11]Senatsverwaltung für Umwelt, Verkehr und Klimaschutz (2020): Mobilität in Berlin: Die Verkehrswende gewinnt an Fahrt. At: ... Continue reading Likewise, the location of the charging infrastructure on pavements can create new barriers for mobility-impaired people. Furthermore, the construction of charging infrastructure in city centres creates an incentive to travel to the centre by (private) electric car, which further increases the pressure to use it. In relation to other modes of transport, the (electric) car requires a lot of space[12]Randelhoff, M. (2014): Vergleich unterschiedlicher Flächeninanspruchnahmen nach Verkehrsarten (pro Person). At: ... Continue reading- space which should primarily be made available to more sustainable modes of transport. Further expansion of electric automobility in urban areas is also questionable from an environmental compatibility point of view, considering Berlin’s very well-developed public transport network and the fact that daily inner-city journeys can be managed by walking or by bicycle due to their usually short distances.[13]Follmer, R. & Gruschwitz, Dana (2019): Mobilität in Deutschland – MiD Kurzreport. Ausgabe 4.0. Studie von infas, DLR, IVT und infas 360 im Auftrag des Bundesministers für Verkehr und digitale Infrastruktur. At: ... Continue reading


So what now?

Following on from these arguments and observations, it is clear that a spatially differentiated consideration is necessary for the further expansion and promotion of electric automobility for the 10% electrified motorised private transport share in the climate-neutral Berlin scenario. This is because the expansion of the charging infrastructure further increases land consumption and with it, the pressure of use. So it is all the more important not to base the expansion of the charging infrastructure on the number of currently registered cars, but on future scenarios and their motorisation rate. The Umweltbundesamt (UBA) proposes a target of an absolute motorisation rate of 150 registered cars per 1,000 inhabitants, including car sharing and taxi vehicles.[14]Umweltbundesamt (2017): Die Stadt für Morgen. Umweltschonend mobil – lärmarm – grün – kompakt – durchmischt. At: ... Continue reading For the target formulated in the new coalition agreement of "a total of at least one charging point for every ten registered vehicles"[15]SPD, Bündnis 90/Die Grünen, Die Linke (2021): Entwurf zur Beschlussfassung des Koalitionsvertrages zwischen Sozialdemokratische Partei Deutschlands (SPD) Landesverband Berlin und Bündnis 90/Die ... Continue reading (p. 64), this would mean that with Berlin's current population size of 3.6 million inhabitants, we would only need 54,000 charging points instead of over 120,000 based on the current number of over 1.2 million registered cars in Berlin. In other words, the expansion of the charging infrastructure in the city centre based on the prevailing car density creates the "wrong" incentive system, especially against the background of the strongly represented ecomobility in Berlin's city centre.


Scenario Number
inhabitants
Number of cars Number of charging
points required given one charging point for 10 registered vehicles
Status quo 3 600 000 1 200 000 120 000
Motorisation
rate 150
3 600 000 540 000 54 000


Table 2: Required charging points depending on the degree of motorisation

In addition to the need for spatial differentiation and to take into account future scenarios of the motorisation rate, further issues need to be considered. One important issue is that the remaining 10% of motorised private transport should primarily be used by those people and groups who are most dependent on a passenger car due to specific mobility needs, regardless of socio-economic factors.[16]Frenzel, I.; Jarass, J.; Trommler, S. & Lenz, B. (2015): Erstnutzer von Elektrofahrzeugen in Deutschland. Nutzerprofile, Anschaffung, Fahrzeugnutzung. DLR Institut für Verkehrsforschung. At: ... Continue reading

Footnotes

Footnotes
1 It is important to note that current studies point out that the stated target year 2045, and thus also the measures formulated in the Energy Transition Act, are not sufficient to stay below the 1.5°C limit (see Rahmstorf, S. et al. (2019): Kipppunkte im Klimasystem: Eine kurze Übersicht. At: http://www.pik-potsdam.de/~stefan/Publications/KipppunkteimKlimasystem-Update2019.pdf [26.10.2021]
2 CO2e (or carbon dioxide equivalents) indicates how much a greenhouse gas contributes to global warming in a given period of time compared to the same amount of CO2.
3 The current figure is 5.2 Mt CO2e. Accordingly, the absolute reduction, measured against today's 5 Mt, would even be 7.8 Mt CO2e, taking into account the current trend. At: https://www.ioew.de/publikation/berlin_paris_konform_machen [26.10.2021]
4 Hirschl, B. et al. (2021): Berlin Paris-konform machen. Eine Aktualisierung der Machbarkeitsstudie „Klimaneutrales Berlin 2050“ mit Blick auf die Anforderungen aus dem UN-Abkommen von Paris. p. 184. At: https://www.ioew.de/projekt/berlin_paris_konform_machen_aktualisierung_der_machbarkeitsstudie_klimaneutrales_berlin_2050 [26.10.2021]
5 Ibid. S.13 and 174.
6 Sikder, S.K. et al. (2018): Halten Sie die Augen nach einer Ladestation offen! – Die E-Ladestations-Infrastruktur in Deutschland: eine räumliche Analyse. At: https://gispoint.de/fileadmin/user_upload/paper_gis_open/AGIT_2018/537647028.pdf [26.10.2021]
7 https://www.vda.de/vda/de/themen/elektromobilitaet/ladenetz-ranking/ladesaeulenregister [26.10.2021]
8 Mobilitätsatlas. Daten und Fakten für die Verkehrswende. (2019). Heinrich Böll Stiftung und VCD. At: https://www.boell.de/sites/default/files/2020-10/mobilitaetsatlas2019_II.pdf?dimension1=ds_mobilitaetsatlas [17.11.2021]
9 It should be noted that a high population density per m2 is not necessarily harmful to the climate.
10 Strößenreuther, H. (2014): Wem gehört die Stadt? Der Flächen-Gerechtigkeits-Report. Mobilität und Flächengerechtigkeit. Eine Vermessung Berliner Straßen. At: https://www.clevere-staedte.de/files/tao/img/blog-news/dokumente/2014-08-05_Flaechen-Gerechtigkeits-Report.pdf [17.11.2021]
11 Senatsverwaltung für Umwelt, Verkehr und Klimaschutz (2020): Mobilität in Berlin: Die Verkehrswende gewinnt an Fahrt. At: https://www.berlin.de/sen/uvk/presse/pressemitteilungen/2020/pressemitteilung.906382.php [17.11.2021]
12 Randelhoff, M. (2014): Vergleich unterschiedlicher Flächeninanspruchnahmen nach Verkehrsarten (pro Person). At: https://www.zukunft-mobilitaet.net/78246/analyse/flaechenbedarf-pkw-fahrrad-bus-strassenbahn-stadtbahn-fussgaenger-metro-bremsverzoegerung-vergleich/ [03.09.2021]
13 Follmer, R. & Gruschwitz, Dana (2019): Mobilität in Deutschland – MiD Kurzreport. Ausgabe 4.0. Studie von infas, DLR, IVT und infas 360 im Auftrag des Bundesministers für Verkehr und digitale Infrastruktur. At: http://www.mobilitaet-in-deutschland.de/pdf/infas_Mobilitaet_in_Deutschland_2017_Kurzreport_DS.pdf [17.11.2021]
14 Umweltbundesamt (2017): Die Stadt für Morgen. Umweltschonend mobil – lärmarm – grün – kompakt – durchmischt. At: https://www.umweltbundesamt.de/sites/default/files/medien/421/publikationen/20170505_stadt_von_morgen_2_auflage_web.pdf [17.11.2021]
15 SPD, Bündnis 90/Die Grünen, Die Linke (2021): Entwurf zur Beschlussfassung des Koalitionsvertrages zwischen Sozialdemokratische Partei Deutschlands (SPD) Landesverband Berlin und Bündnis 90/Die Grünen Landesverband Berlin und Die Linke Landesverband Berlin über die Bildung einer Landesregierung für die Legislaturperiode 2021-2026. At: https://spd.berlin/media/2021/11/Koalitionsvertrag-Zukunftshauptstadt-Berlin.pdf [06.12.2021]
16 Frenzel, I.; Jarass, J.; Trommler, S. & Lenz, B. (2015): Erstnutzer von Elektrofahrzeugen in Deutschland. Nutzerprofile, Anschaffung, Fahrzeugnutzung. DLR Institut für Verkehrsforschung. At: https://elib.dlr.de/96491/1/Ergebnisbericht_E-Nutzer_2015.pdf [03.09.2021]
EN